

John H. Welch
Research for Emerging Markets
August 8, 2025
· I asked the question in July: Is the Fed’s inflation target 2 or not?
· The answer was “No.”
· I ask it again here.
· The answer is still “No.”
· The market (and the executive) wants the Fed to ease.
· We think this would prove a mistake and the outcome would rhyme with the1970s, the Covid-19 accelerating inflation experiences.
· Easier money will not help the negative real GDP effects of the tariff and by over-accommodating the price shock, Fed credibility will once again suffer.
· We wrote that under any circumstance, the curve would disinvert and then steepen, just as it has. We expect this steepening trend to continue, especially if the Fed eases.
Back in September 2024, I asked the question: is the Fed’s Inflation target 2% or not? The answer is clearly not 2%. The labor market is extremely tight and for now and inflation expectations are firmly above 2% – most measures above 3% – and the Fed is now facing a supply-side shock potentially larger than the COVID-19 Pandemic. At the time, the Fed and the Treasury reacted by flooding the market with monetary base, effectively monetizing the supposedly temporary massive increase in fiscal deficits. Fiscal expansion was appropriate to a real shock, however, massive loosening of monetary policy was not. The proof is the significant increase in inflation, the highest in 40 years. If my forecast proves correct, will the Fed react in the same way as it did to COVID? At the time, I thought the Fed loosening was inappropriate as it was a real shock not a financial one, unlike the 2008-09. Loosening fiscal policy, temporarily, was the correct reaction, although fiscal loosening proved persistent as opposed to temporary. The combination led to the escalation of inflation.
The reaction to COVID was like giving more chemotherapy to a cancer patient that was in remission and had the flu. Not a good outcome. Here we are a year later with a Fed Funds rate 100 basis points below where it was before the September meeting of last year and inflation shows no sign of going towards 2%. In fact, it's accelerating again. And still many analysts and even Fed Governors are now calling for the cut. We are above full employment even with the revisions to the labor numbers and inflation is accelerating. There is no reason to cut the Fed funds rate, in my view.
The Fed ignored a lesson we learned over the last 40 years in emerging markets that suffer frequent external shocks. A negative supply shock causes prices to rise and output to fall. The trick is to accommodate the initial shock allowing scarce resources to have an increase in prices but then lean against the secondary and tertiary price increases that come later. The only way the Fed can “look thought the shock” is if all are confident the Fed will act to bring inflation back to 2%. It seems that some at the Federal Reserve have learned this lesson others including the executive branch and investors have not.
The Trump administration's tariffs only really go into effect this week taking the effect of tariff on imports from 2% to 18.5%, at least as far as we know it. Because of carve outs, the effects on each sector are extremely difficult to gauge. Moreover, firms and consumers cannot react right away but over time they will make substitutions between markets and sources of inputs. Hence, the short-term and the long-term may prove decidedly different. We also do not know how many bilateral agreements the United States strike but even excluding each of the categories of goods if we made bilateral agreements with ten other countries that means we would have 1,810,000 different outcomes. This is extremely hard to track and very difficult for businesses to plan investment and other actions over even the near future.
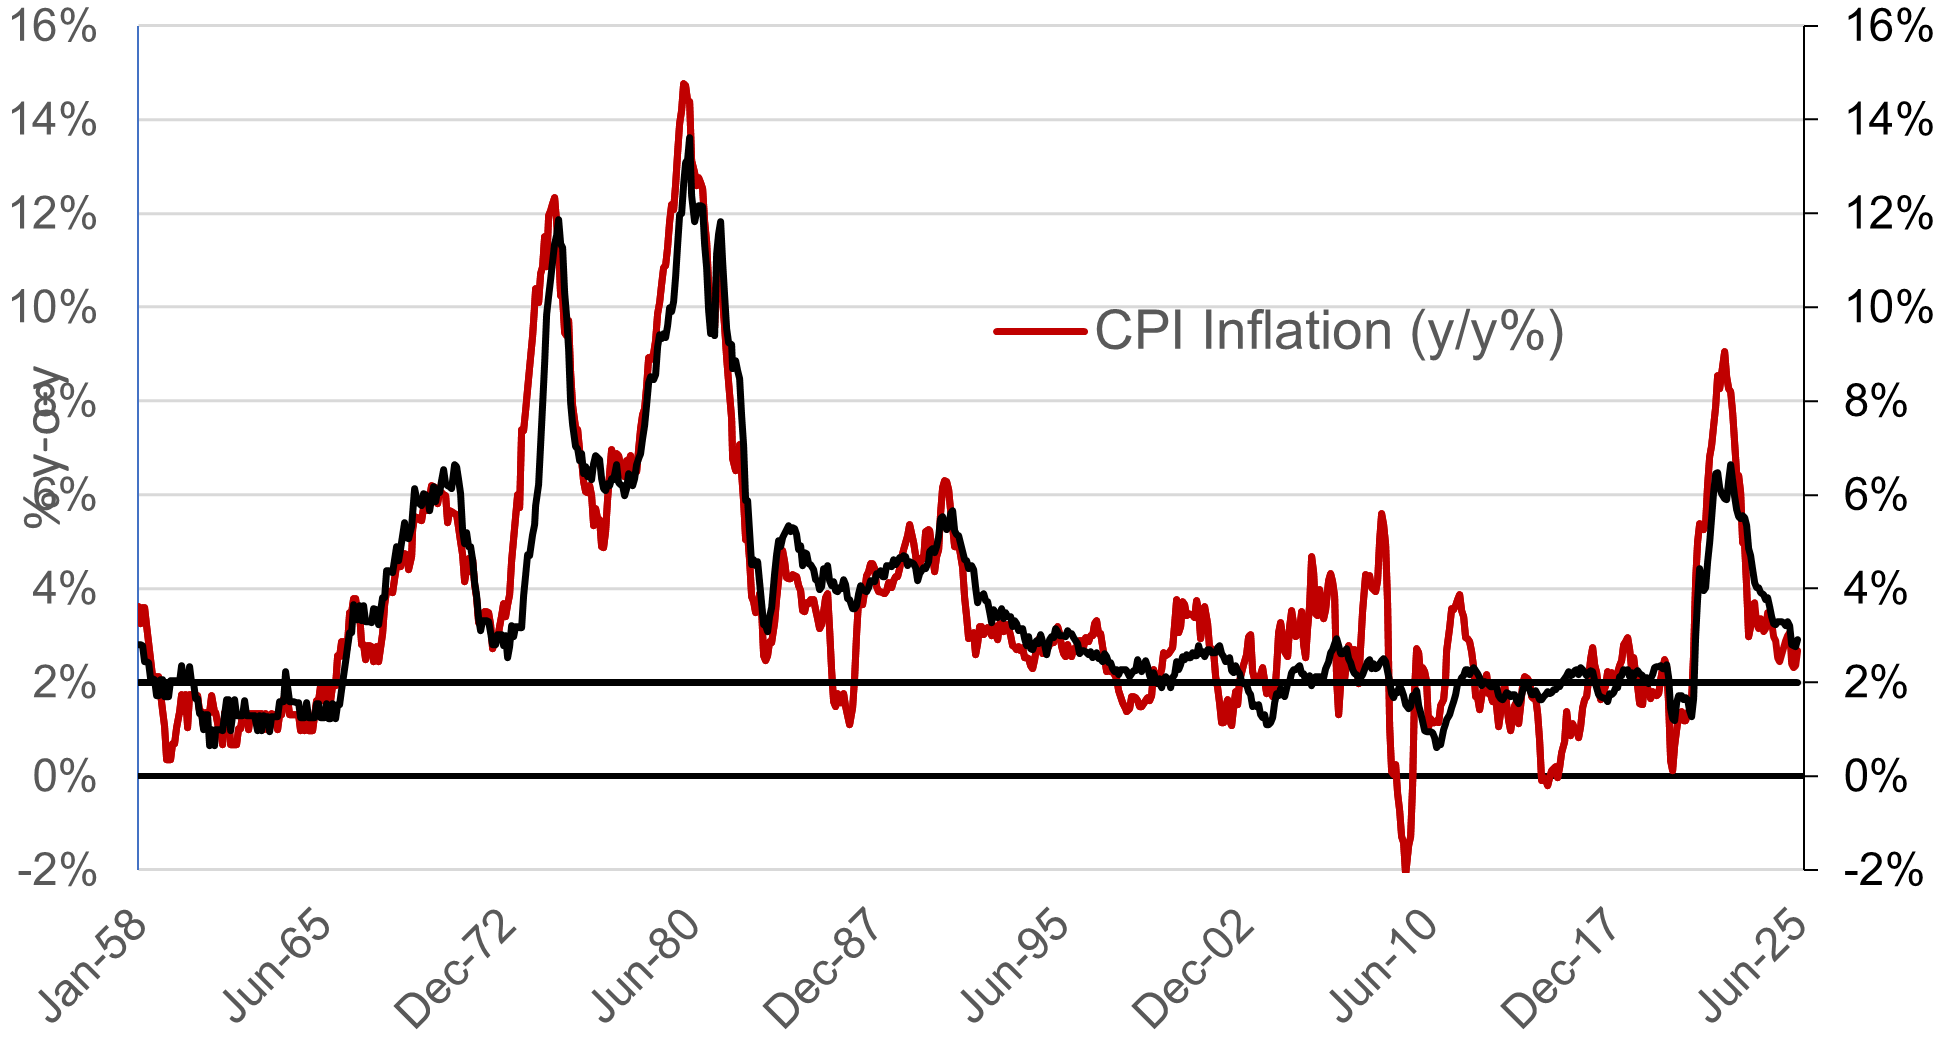
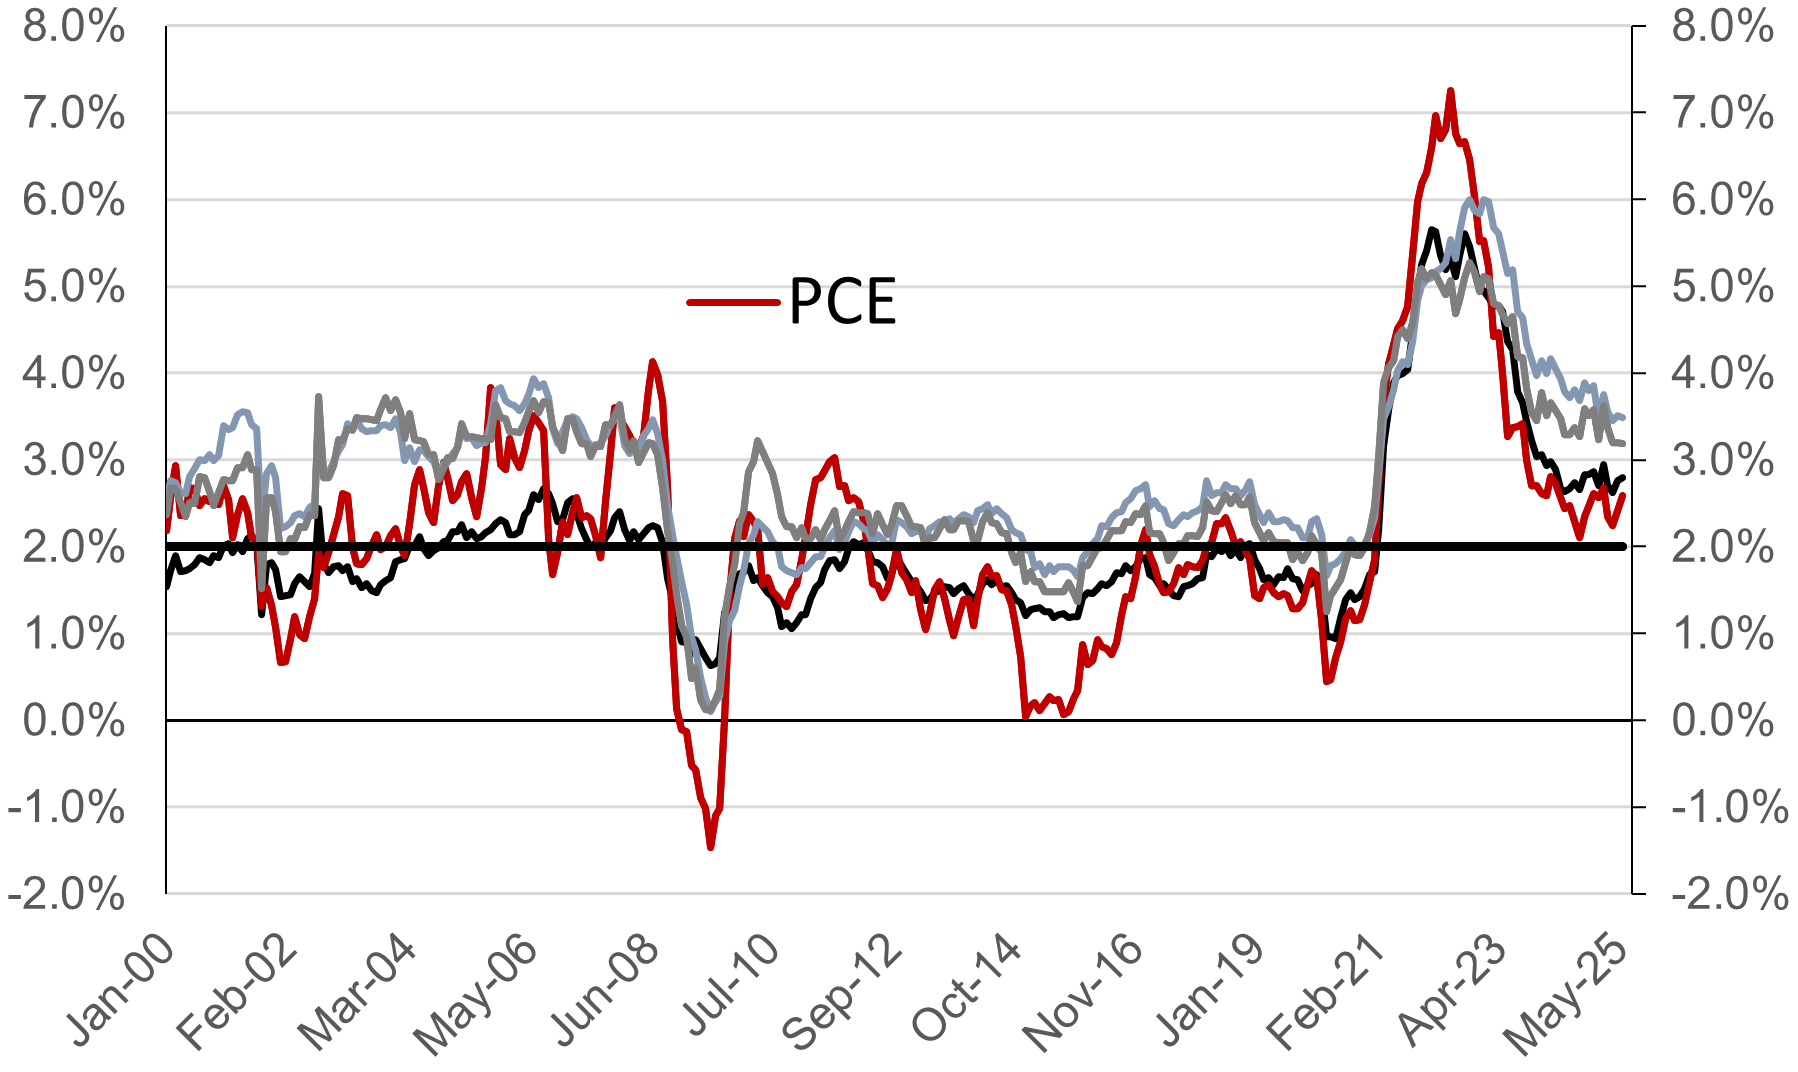
Current inflation rates have fallen the rate of decline is either stalled or significantly slowed. The existing trends look like inflation continues to decline but at an excruciatingly slow pace. Neither CPI, nor Core CPI, nor PC more Core PCE, nor Core PCE service inflation are at the 2% target. In fact, they are at least 50 basis points away and in some cases above 3% (Charts 1 and 2). The BES just released June 2024 PCE numbers with headline inflation unchanged from 2.6% y-o-y to 2.5% and core PCE as literally unchanged at 2.6%. Core service inflation fell marginally from 3.97% y-o-y to a still high 3.89% compared to the 2% target. All remained well above the 2% target. The next section looks at a couple of measures of inflation expectations that also continues significantly above 2%.
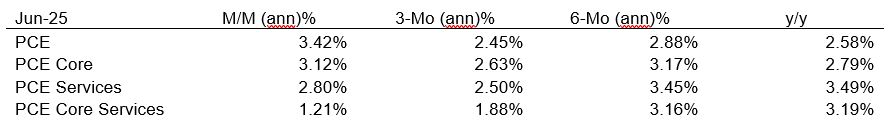
Looking at Table 1, some analysts see signs of continued deceleration and inflation. In fact, there are few signs of that inflation is decelerating but there are signs of reacceleration and stagnation. June headline and Core PCE inflation rates have reaccelerated. PCE inflation is above 2% at all backward horizons and above 3% annualized for y-o-y for June. PCE Core services - so-called “super core” - fell back to 1.9% annualized for the last three months but is still above 3% at other backward horizons. In my view, these numbers do not yet translate that inflation is converging to 2%. On the contrary, they show clear risks of reacceleration, especially if the Fed cuts the Fed Funds rate.
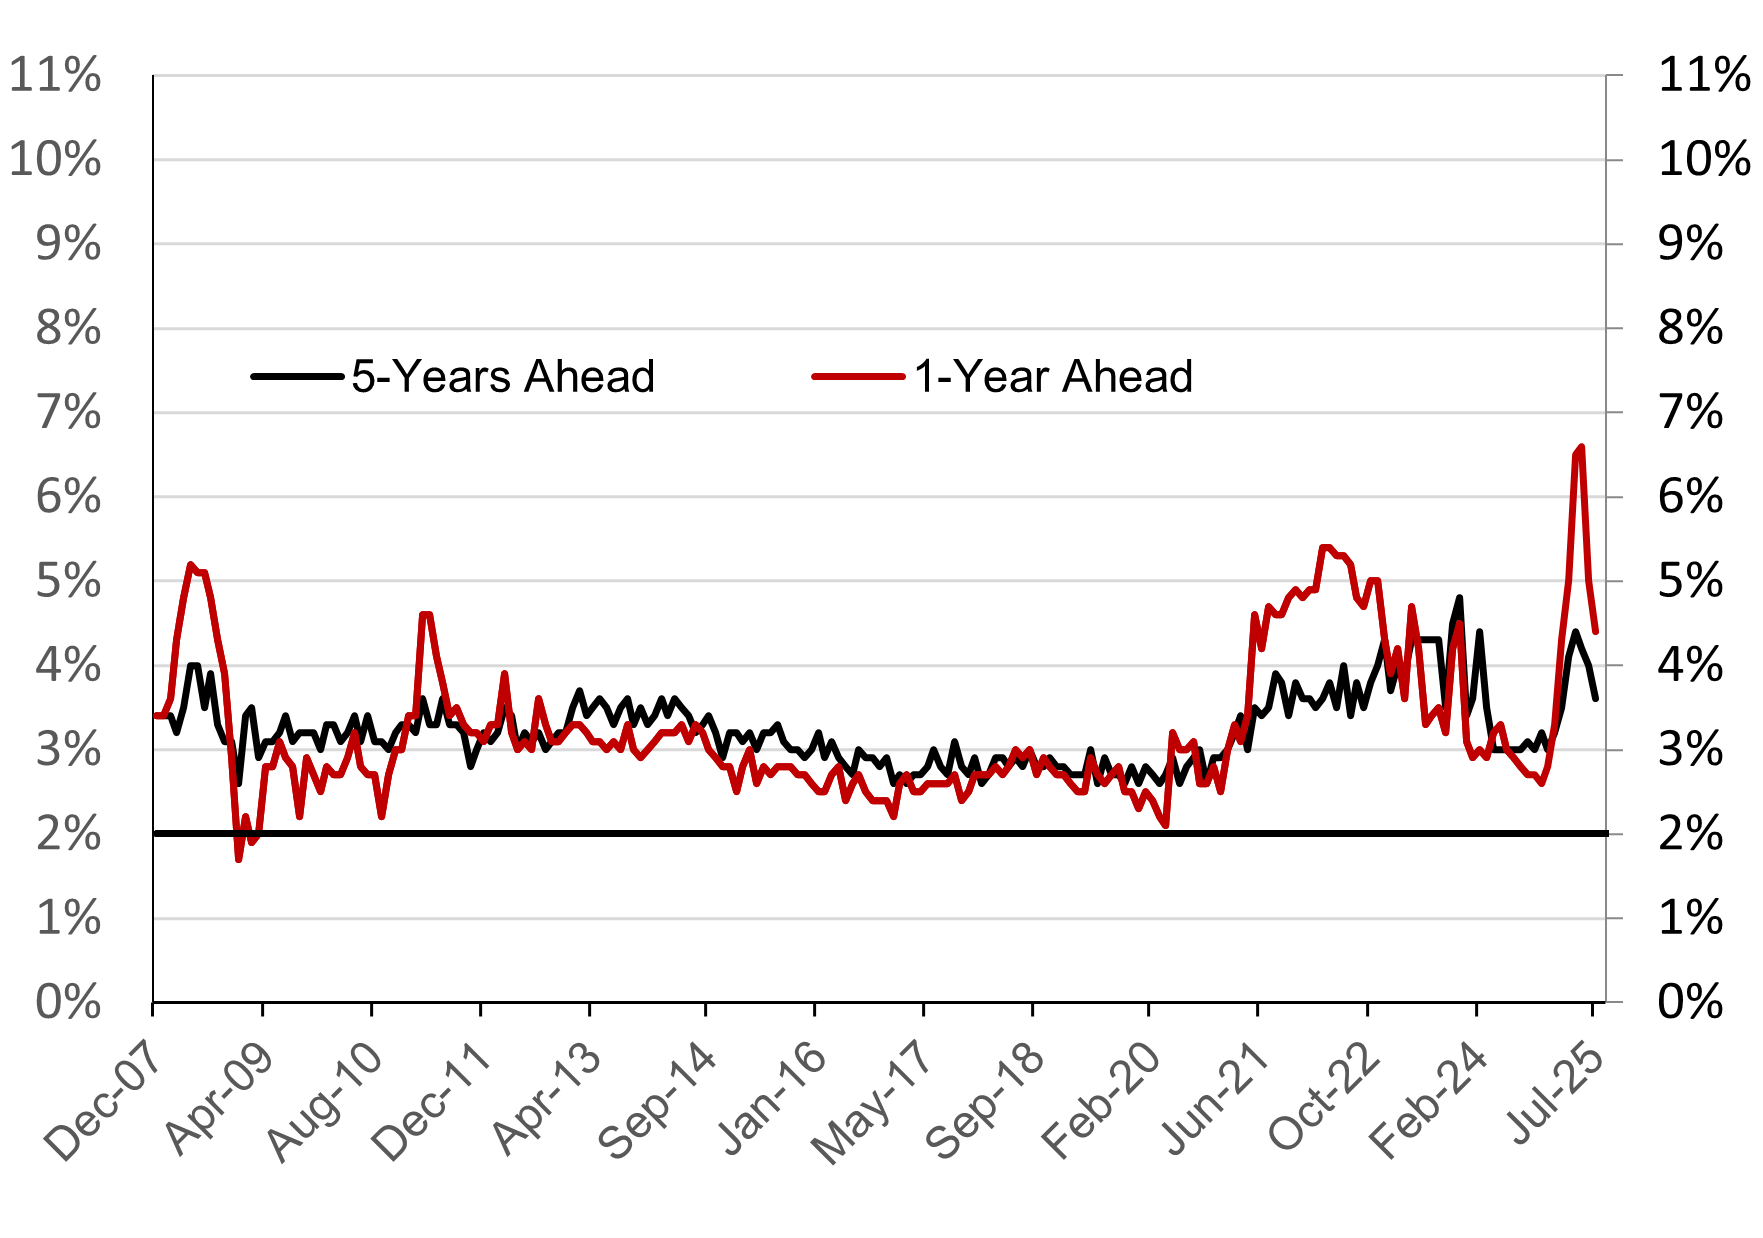
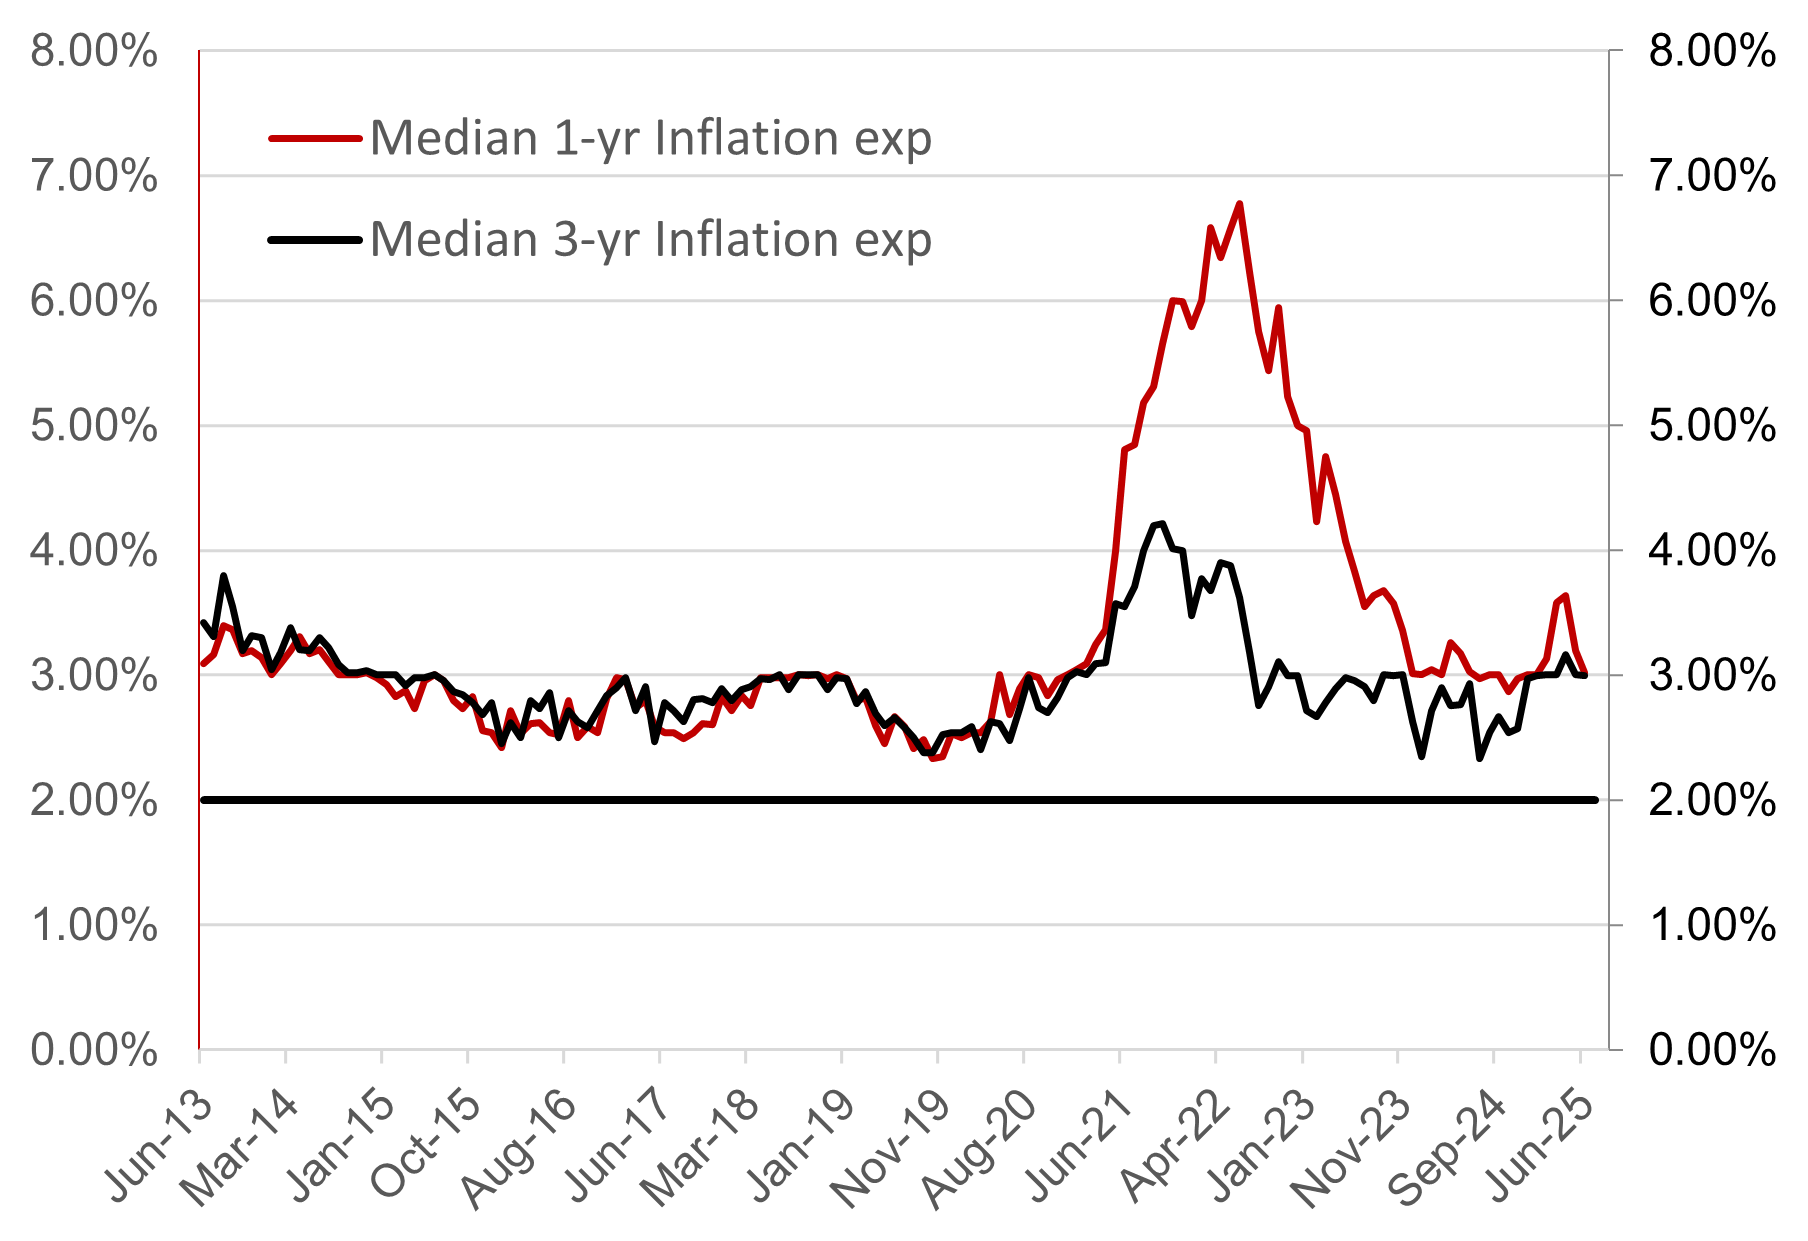
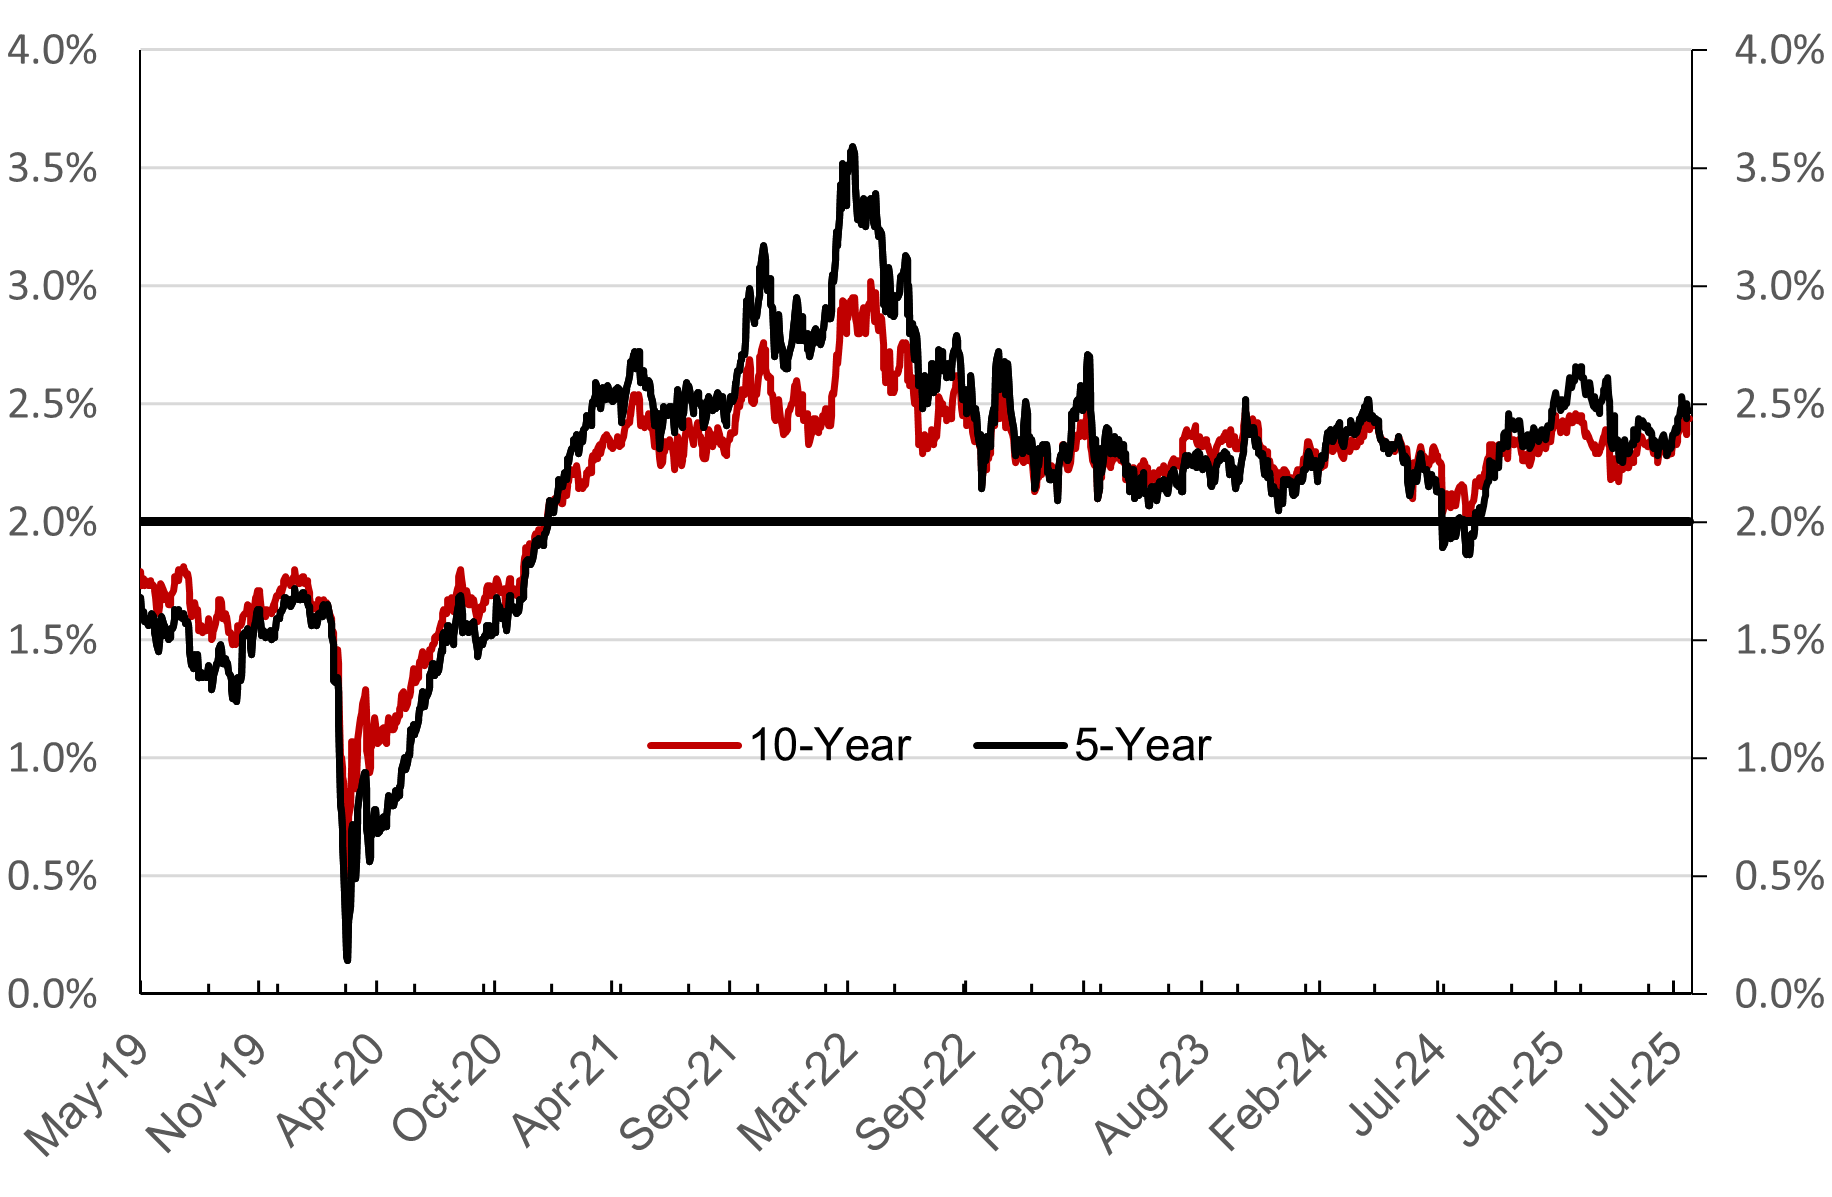
Measuring inflation expectations is problematic. We look again at two surveys and at inflation break evens from the tips market and the US treasury market. Here, we will only look at two of them. Chart 1 shows that both the 1-year and 5-year ahead inflation rate expectations from the University of Michigan remain well above 3% let alone 2%. Chart 4 shows that the FRB-New York surveys had 1-year ahead inflation expectations stagnating above at around 3 % and 3-year accelerating, also at 3%. Finally, Chart 5 shows the 5-year and 10-year Break-Even Inflation rates implied by the 5-year and 10-year US Treasury and Tips markets and both have risen. Again, as in 2Q2024, current inflation expectations remain above the 2% target by any measure. Expectations were declining briskly and then stopped. It is hard to see how the Fed is comfortable with the trajectory of inflation declining to 2%.
Many have somehow concluded that tariffs would not have any deleterious effects on the price level but also on labor activity. They point to relatively strong labor markets, at least until the July 2025 numbers were released along with revision. Many argued the lack of signs of economic downturn and worsening employment results must have thought that firms would immediately stop hiring and would fire workers if the tariffs hurt. This makes no sense at all, especially because we still do not know the final tariffs on what countries and what products in addition to the questionable constitutionality of imposing trade restrictions by presidential fiat. As an example, if the United States signs 10 different trade agreements and ignoring differential treatment of particular goods, the number of different possible trade agreements is 1,810,000 (10!/2!). Companies have to come up with strategies for each one of them and adding the different types of exports and imports, the calculation will challenge ChatGPT.[1] Employers will naturally wait until they see the final versions of the tariffs and also see the results before they will make major employment decisions. They will, however, stop hiring at first and this is already showing up in the data.
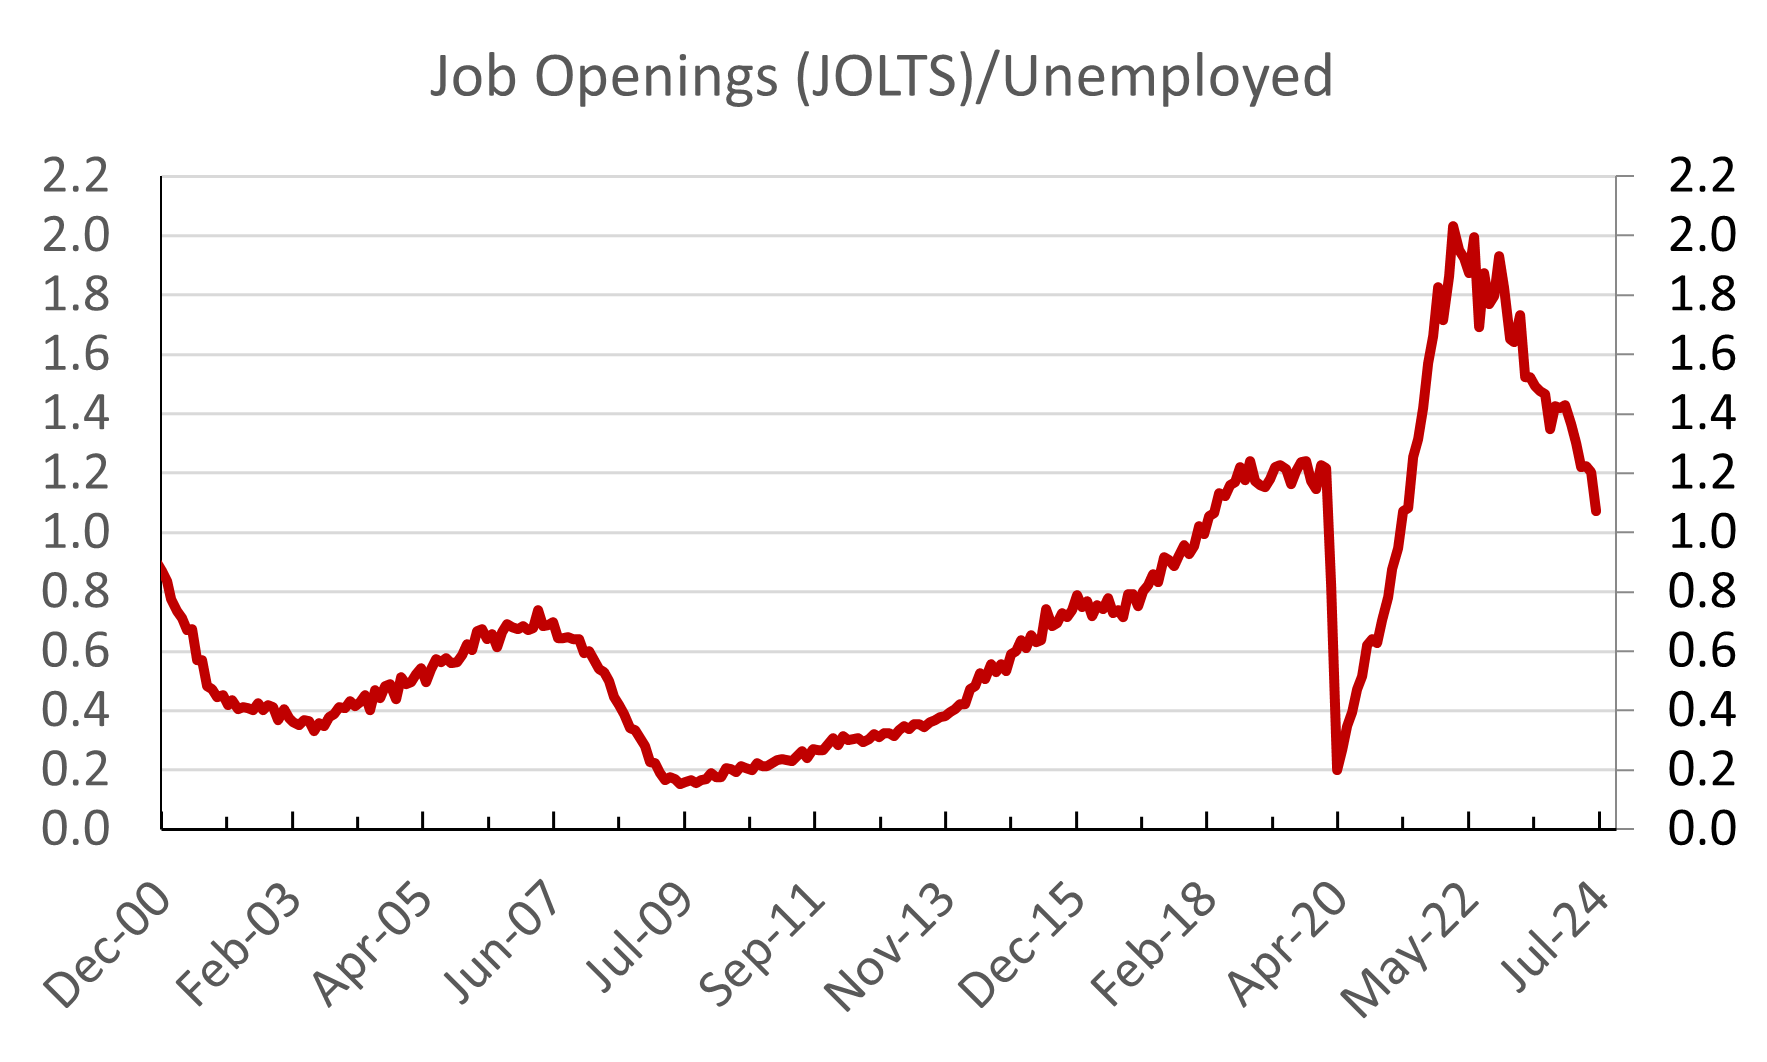
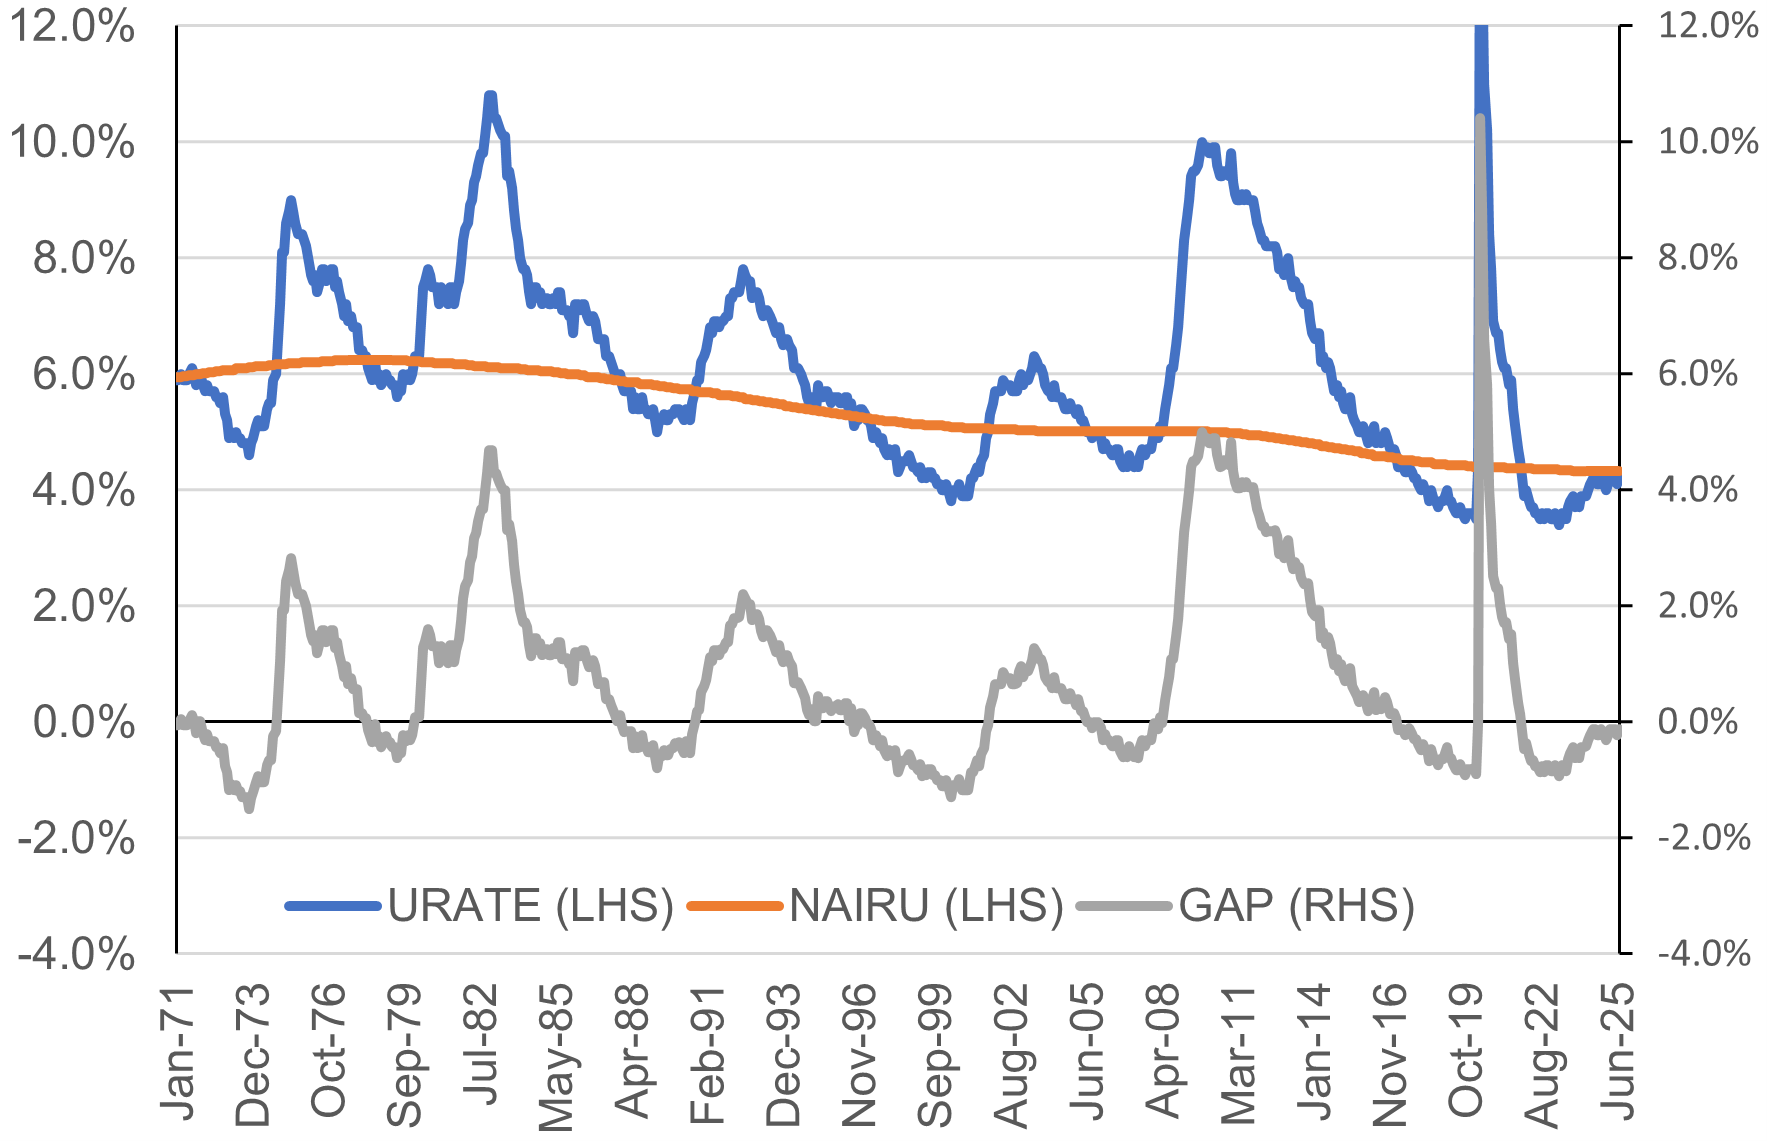
Chart 6 even after the weak July payroll number (73K) and the downward revisions (258K) for May and June, well below the previous readings. Still, the unemployment rate rose only 0.1 percentage points to 4.2% from 4.1%, including the revisions shows that the labor market is still tight with 1.03 job openings per unemployed worker. Chart 7 shows the actual unemployment rate and the non-accelerating inflation rate of unemployment (NAIRU or natural unemployment rate). The current rate is still below the full-employment unemployment rate. The only conclusion is that we still have a tight labor market.
The trend and expectations are not positive. The employment component of July Services ISM came in significantly weaker, falling to 46.4 from 50.7 in May 2025 and 51.0 in July 2024. Prices paid has risen significantly to 69.9 from 68.7 in May 2025 and 57.3 in July 2024.
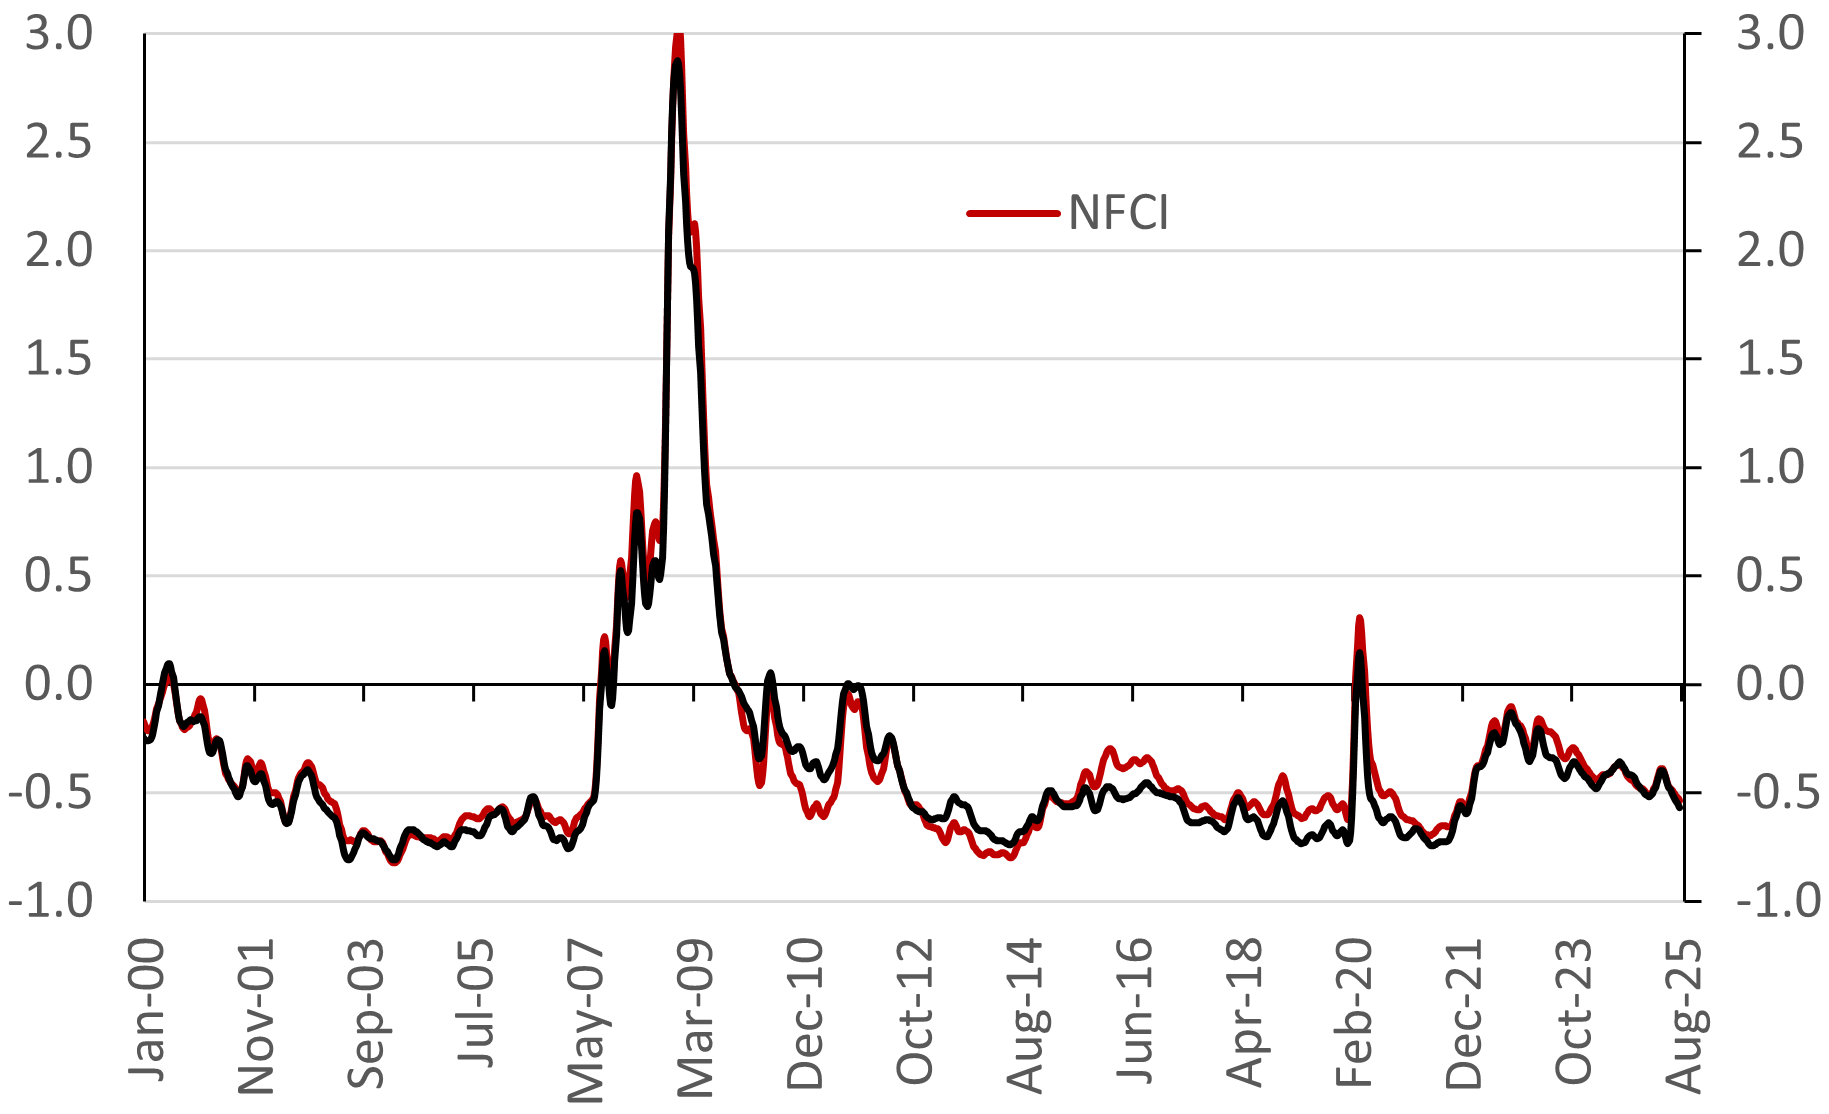
Updating the National Financial Conditions Indexes published by the Federal Reserve Bank of Chicago, on the other hand, still show financial conditions as loose (Chart 8). All this indicates that the Fed ‘pause’ is, at best, premature. In fact, financial conditions and monetary conditions have eased since earlier this year. This indicator might be flawed but then again, the banking system is well capitalized and underleverage so a huge tightening of financial conditions despite tighter money does not seem in the offing. This might even reflect a McKinnon-Shaw effect or higher interest rates create more liquidity and better financial conditions as banks are more likely to lend at higher rates individuals are more likely to keep money in bank deposits and short-term bonds.
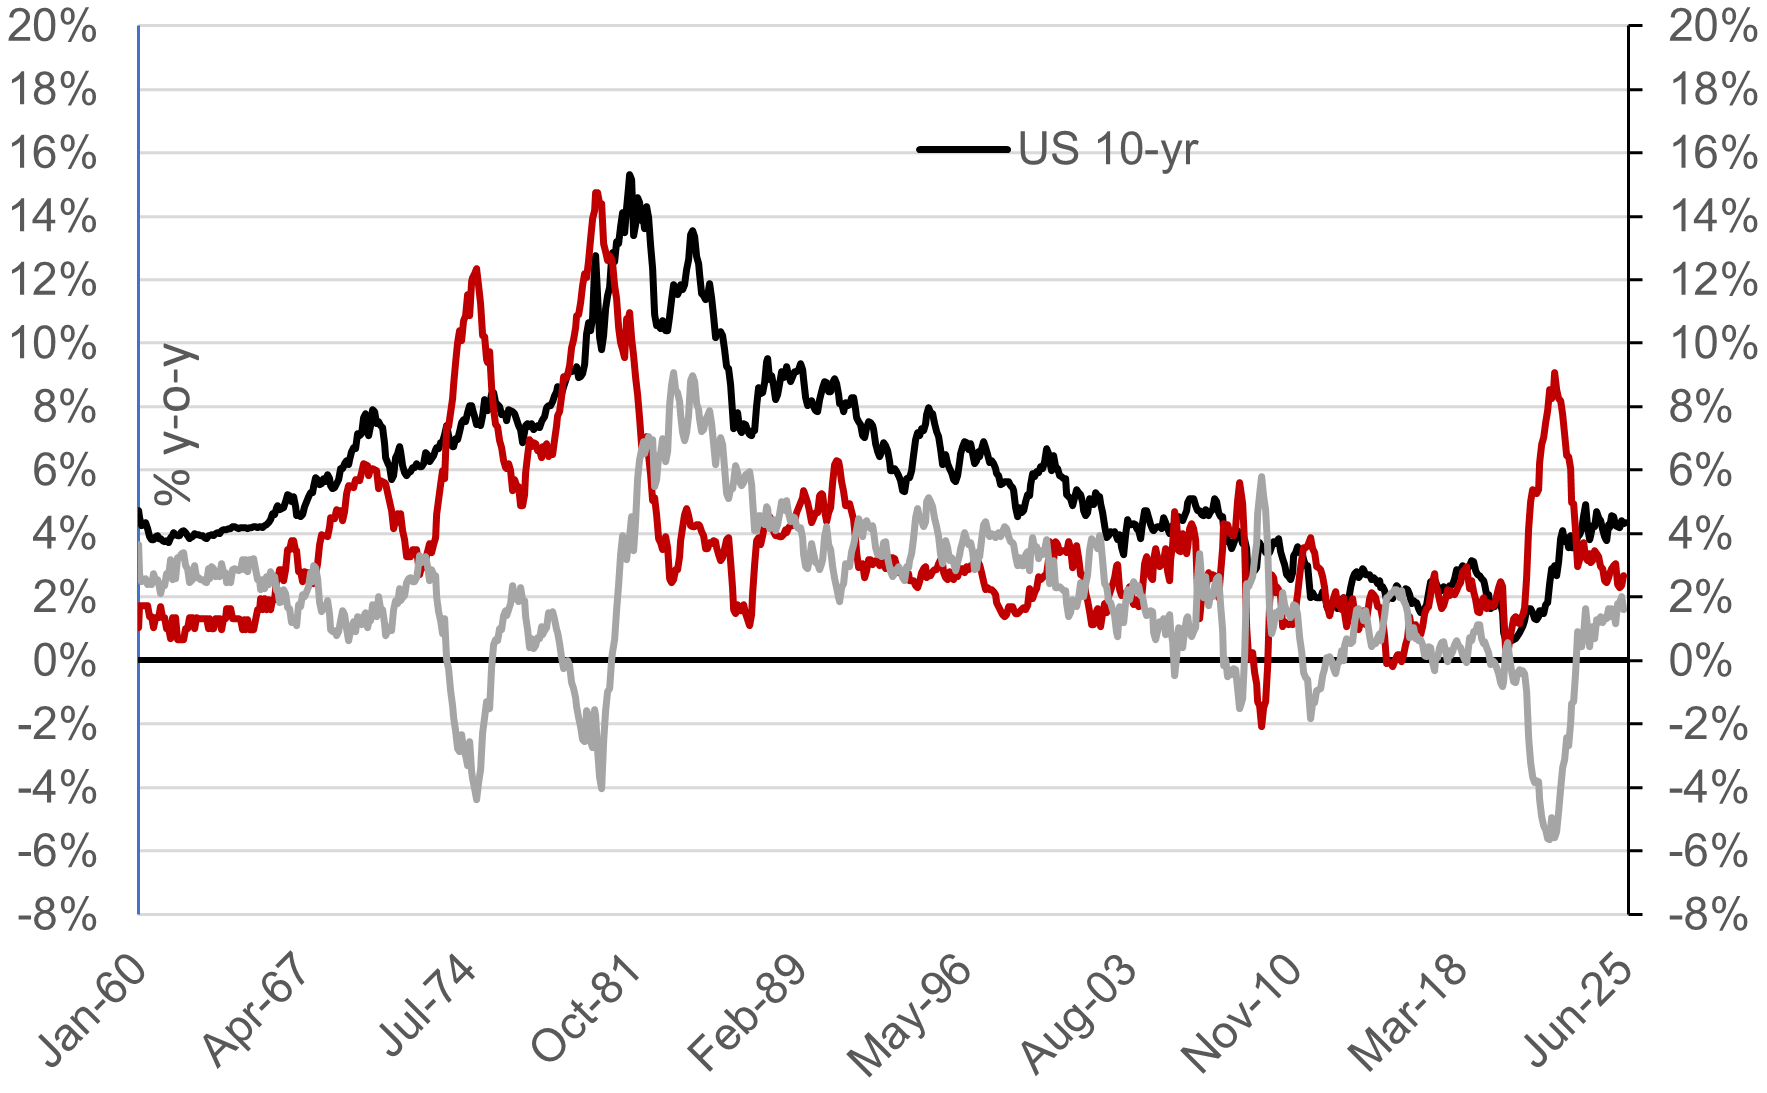
US Treasuries rates have backed up after seeming lost their way up. The market for US Treasuries is back to discounting a high probability of cuts in the Fed Funds rate before end-2025. Even with a rising PCE inflation and despite the economy operating at near or even above full employment, not to mention the supply side shock engendered by the massive increases in tariffs. Chart 9 shows the US Treasury 10-year note rate in nominal and real terms.
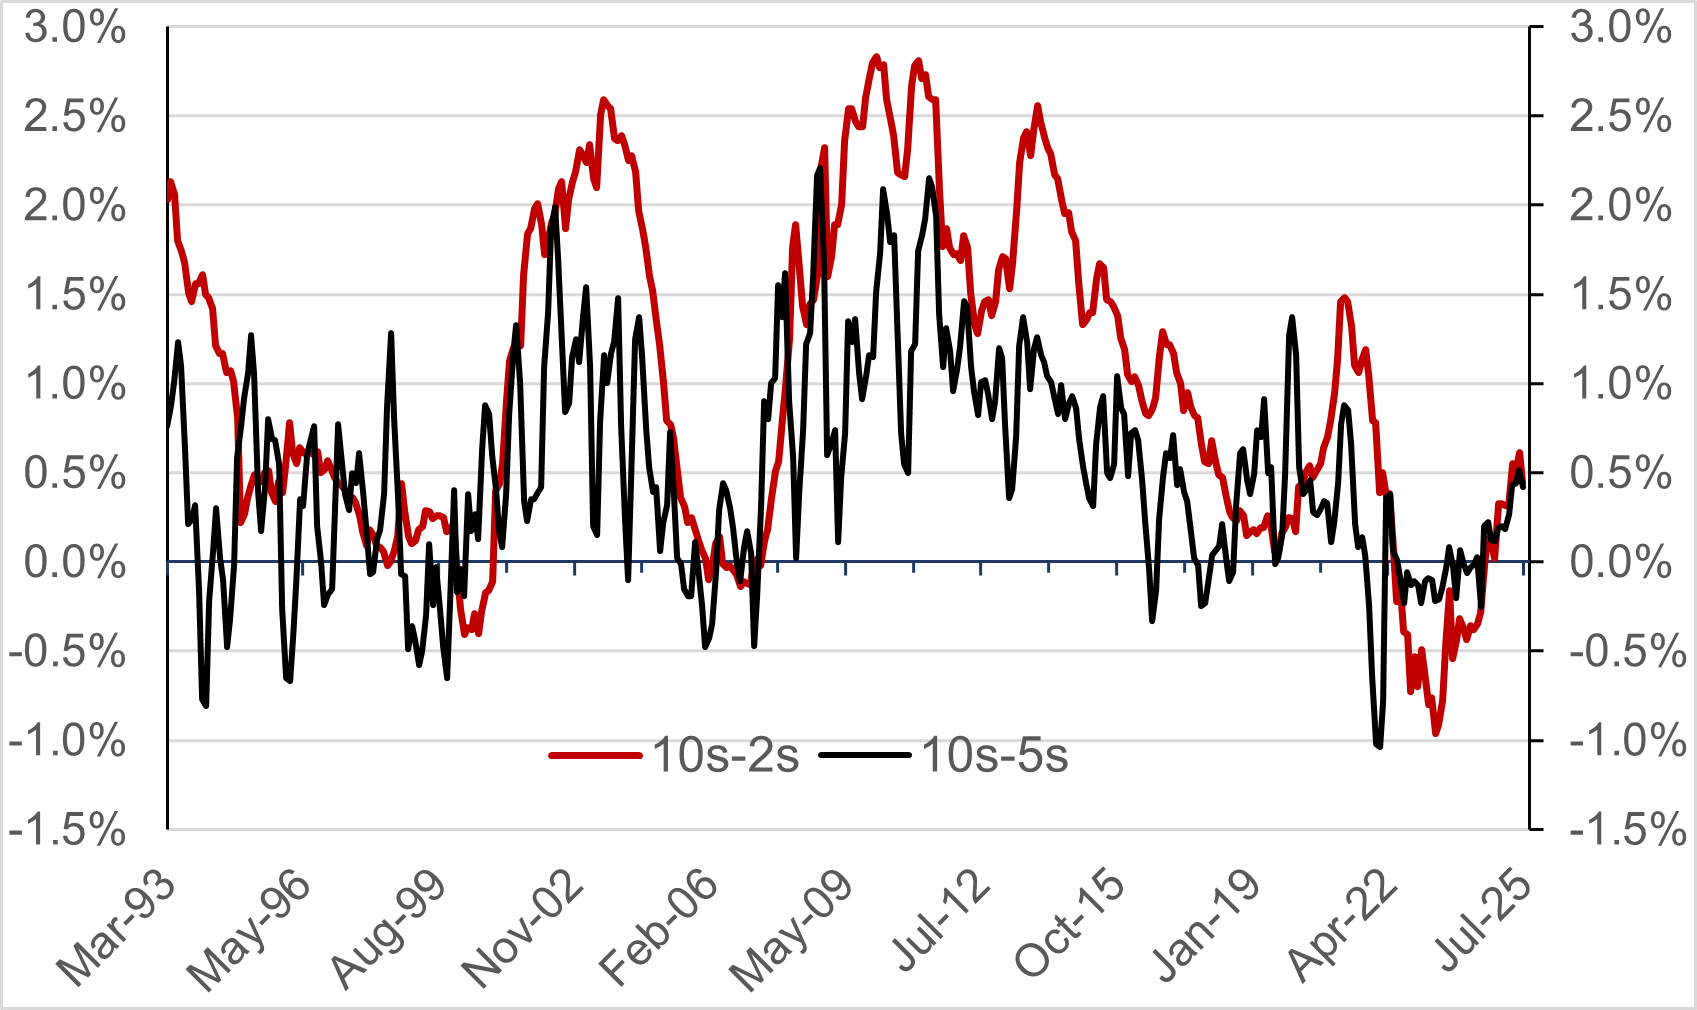
We can see this in Chart 10 where disinversion and now definitive steepening of the US Treasury curve is evident. Both 10s-2s spread and 10s-5s show significant steepening. The huge Treasury issuance to finance large budget deficits continues to add fuel to the curve steepening.
In this environment, we would keep our powder dry and buy the 10-year is we get another back-up on “disappointing” economic strength and labor market tightness. We would also recommend keeping a steepener – whether bull or not – buying US10-year and selling US 10-year bonds.
A Final Comment on Tariffs and The Fed’s Monetary Policy Stance
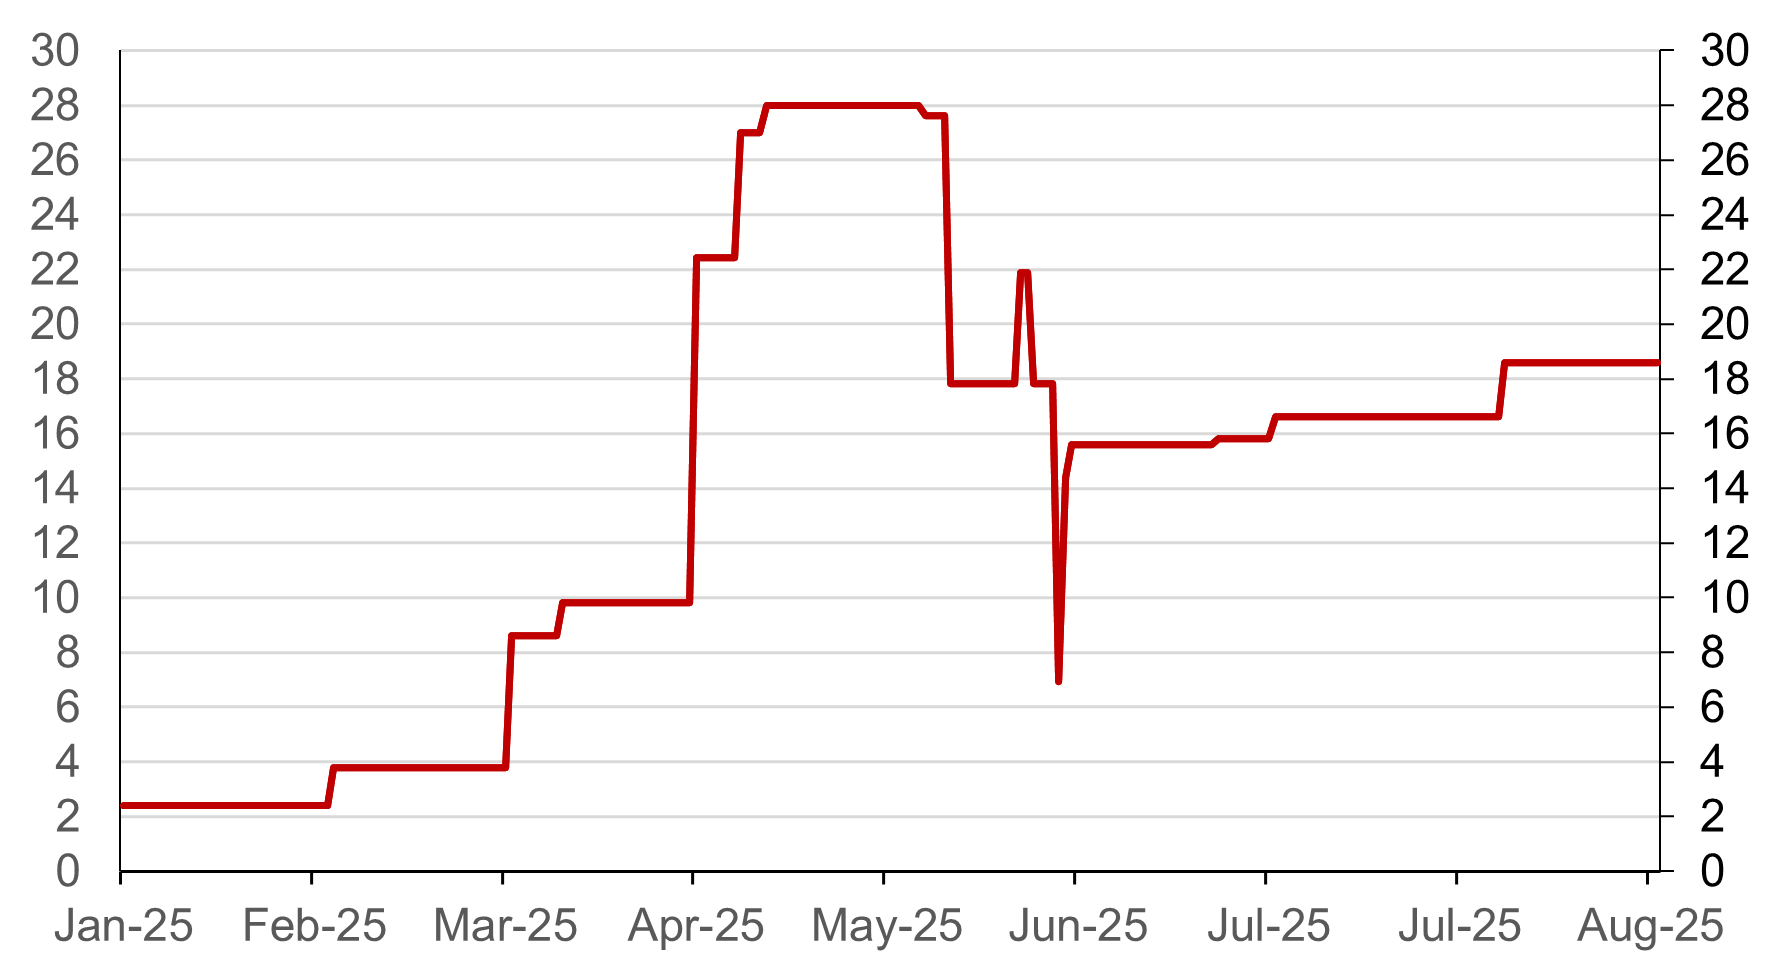
Going back to the original question in the title of this piece is the tariff shock a larger shock than COVID? The tariffs went fully into effect on the 8th of August 2025 and that last look the average tariff stands at 18.6%, up from 2% (Chart 11). Looking at the material several different sources including Yale University's budget lab, the shock looks smaller than COVID in the short term but much larger in the longer term. My reasoning is the following that used individuals immediately started adjusting to the temporary COVID pandemic . The ability of individuals to adjust to what looks like permanent changes in tariffs whatever they end up is more limited. The budget lab goes through the short term and the long term and clearly the ability of individuals to substitute goods markets and inputs is much more difficult in the short term but there is some leeway in the long term. Despite the fact that the shock will dissipate slightly over time, it will stay with us until we lower our tariffs again. That makes in my view a present discounted basis in the costs of this shock larger than COVID.
The Fed is at a crossroads, again. It can repeat the mistakes of the COVID and 1970s experiences by loosening too early. In my view the odds are that such a stance would exacerbate already accelerating inflation. As in the external shocks and emerging markets the Fed should follow the now conventional reaction to external shocks by accommodating the shock and then leaning against it. That would mean at the very least no easing of monetary stance in the reasonable future.
Is the Fed currently tight, neutral, or loose? We will not go through the tedium of creating a monetary conditions index but will look at the real Fed Funds rate and stay informed about the FRB Chicago’s Financial Conditions Index. Right now, the backward-looking real interest rate stands between 1.1% and 1.67% using Table 1. The forward-looking real Fed Funds Rate using The University of Michigan, FRB-NY, and 5-year TIPs rate is between -0.07% and 1.34%. The conventional wisdom now is that equilibrium real interest rate, r*, is somewhere close to 1%. Holston, Laubach and Williams’(2023) currently has r* just under 1%(Chart 12).
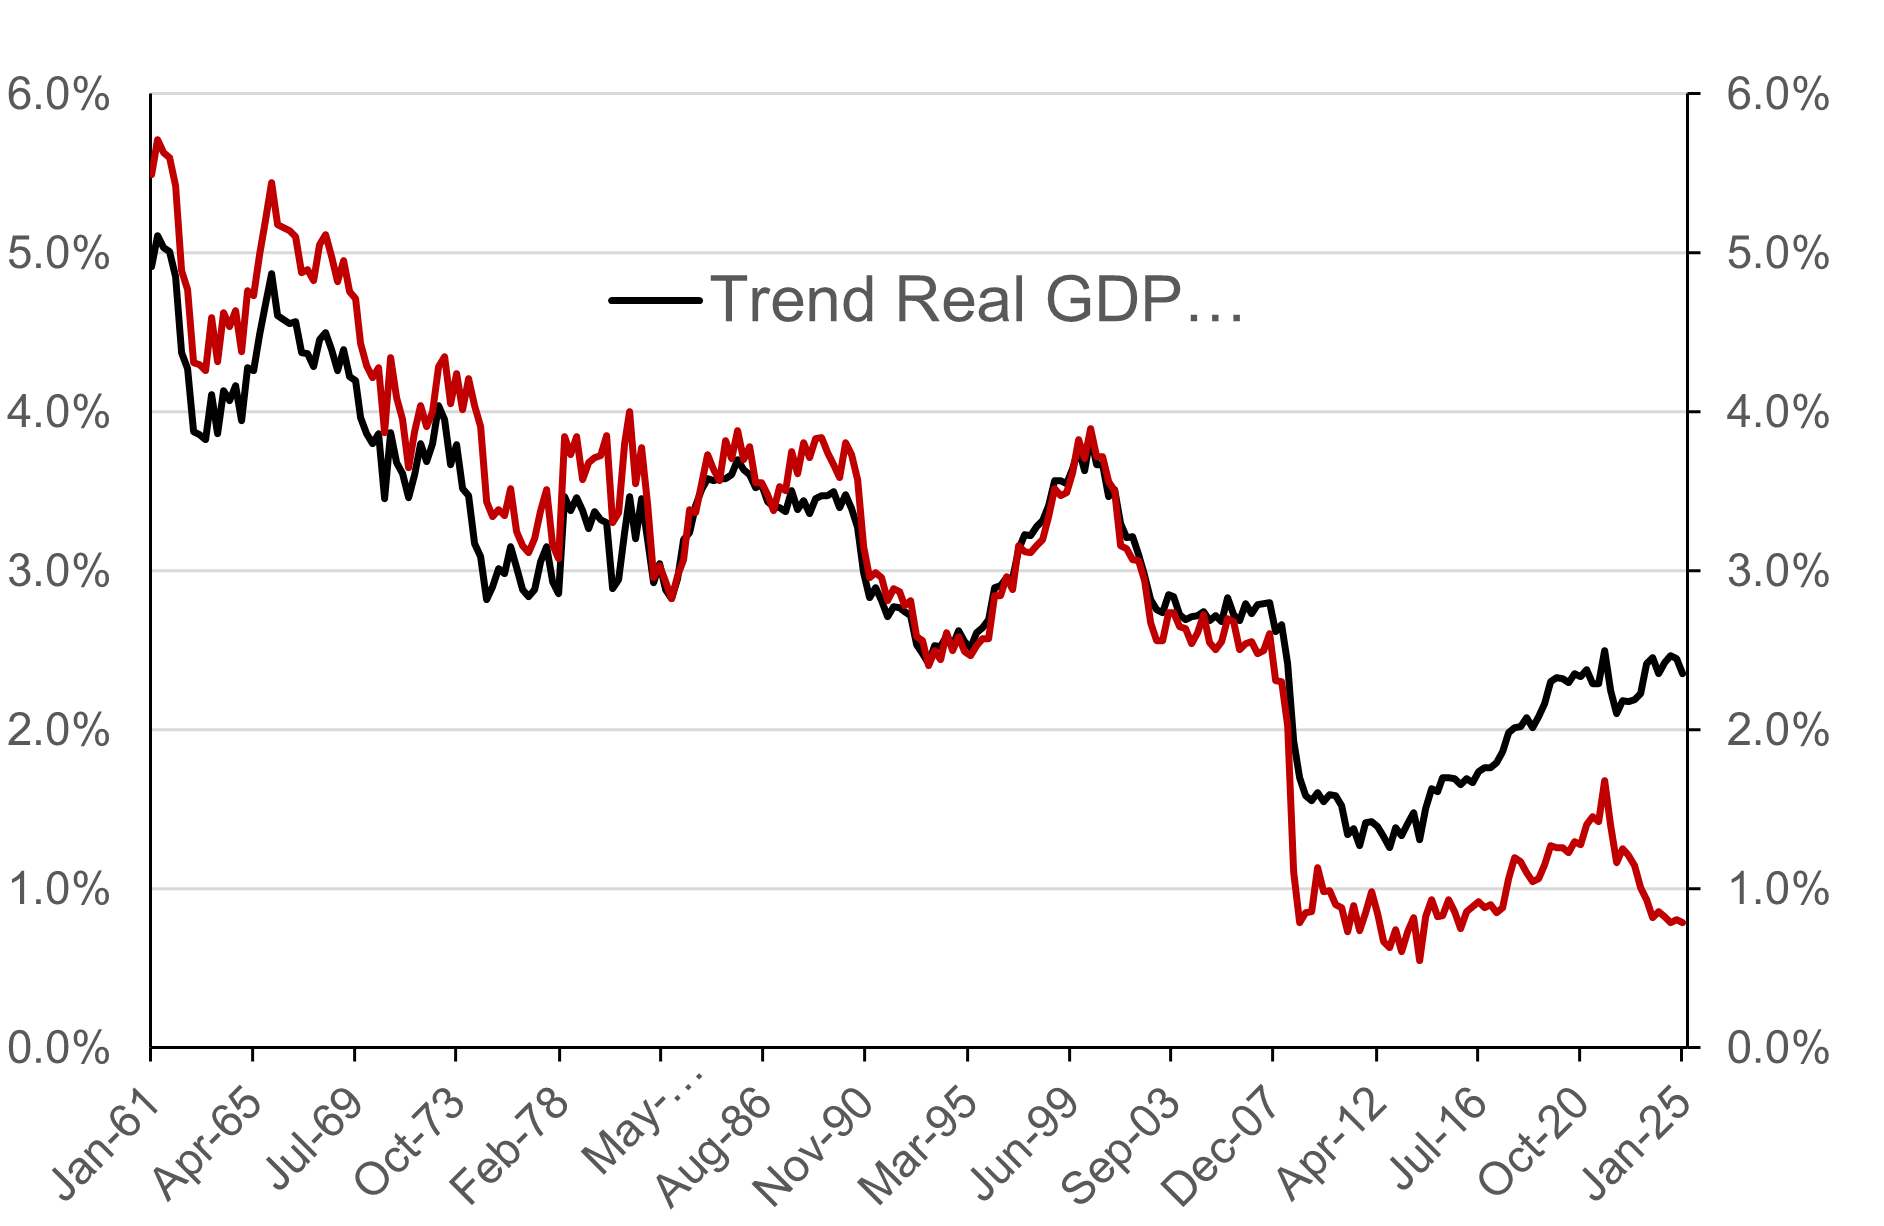
By this metric, the Fed is perhaps a little bit tight or perhaps a little bit loose. Let's call it neutral to slightly loose given the monetary conditions measured by the Chicago Fed. However, the US economy has seen significantly higher productivity growth over the past year, perhaps due to AI in some way. The 2Q2025 numbers bear that out with productivity growth of 2.4% in the second quarter and, in chart 12, with the rise in the average trend real GDP growth rate. Moreover, the US government is currently running a 6% of GDP deficit with a 3% of GDP primary deficit and debt to GDP around 100% and growing. Both phenomena put upward pressure on the equilibrium real interest rate r* despite FRB Governor Waller’s admonition tha thigher productivity calls for lower real interest rate. Productivity increases the rate of return to capital increasing the demand for credit and putting upward pressure on interest rates. My intuition is that the real equilibrium rate of interest is higher than 2% and I am not alone. I will follow this note with a Kalman filter estimate of r* incorporate these new trends.
[1] This argument is similar to that made by Peter J. Boettke and Rosolino Candela (2023):” On the feasibility of Technosocialism,”Volume 205, January, Pages 44-54, among others.

Brasil Plural Investment Advisors LLC (Plural Advisors or BPIA) is registered with the New York and Florida Bureaus of Financial Regulation. All information contained herein is for informational purposes only and is not designed to solicit clients or provide investment recommendations or services. The content provided offers general information only and should not be interpreted without obtaining and obtaining specific advice from a licensed professional in relation to the user's own situation and concerns. BPIA does not reproduce financial planning or advisory services on this website. The material contained herein is for informational purposes only and does not constitute a fair representation of the investments contained herein to any person. BPIA does not serve as an attorney or liaison, and no part of this website should be construed as legal or accounting advice. Different types of investments involve a variety of risks and cannot be subject to assuring future profitable performance or equal historical performance for any particular investment strategy or investment. BPIA is committed to protecting your privacy. We will not collect any personally identifiable information without your consent. Your personal information will not be sold or shared with unaffiliated third parties except as necessary to disclose information to process transactions or when required by law.